En aquest projecte s'hi han descarregat les dades de la proteïna des de https://www.rcsb.org/structure/6NUQ per analitzar l'efecte d'aquests components davant la proteïna.
El que volem amb aquest projecte és comprovar quin component, amb una unió d'energia negativa major, és el més compatible amb la proteïna 6NUQ per tal que no s'uneixi amb una molècula cancerígena i no s'acabi propagant per tot l'individu.
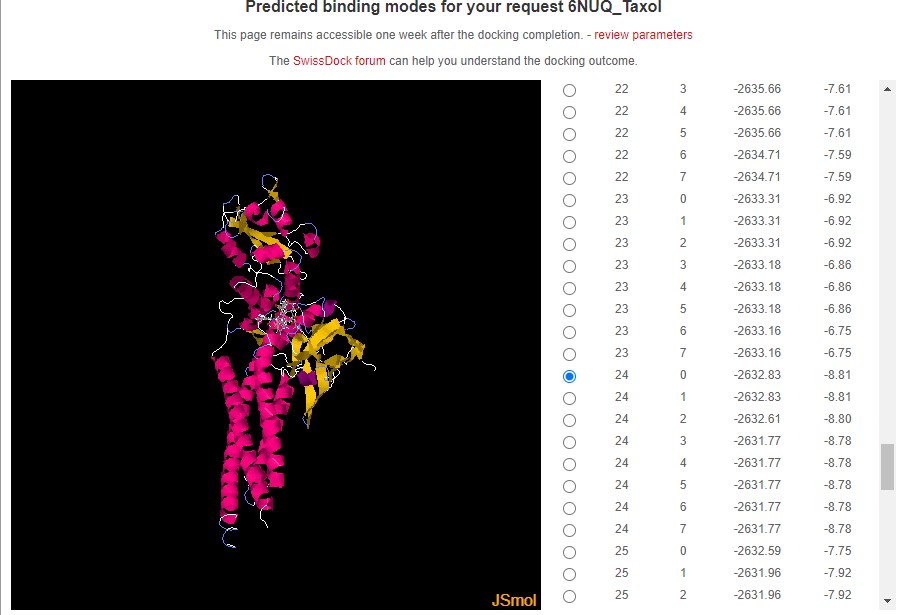
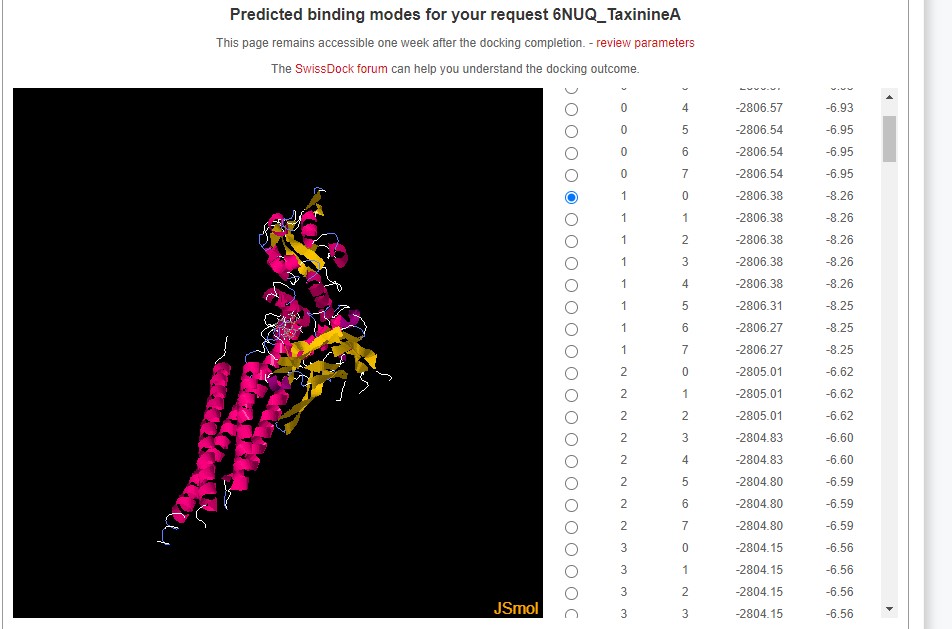
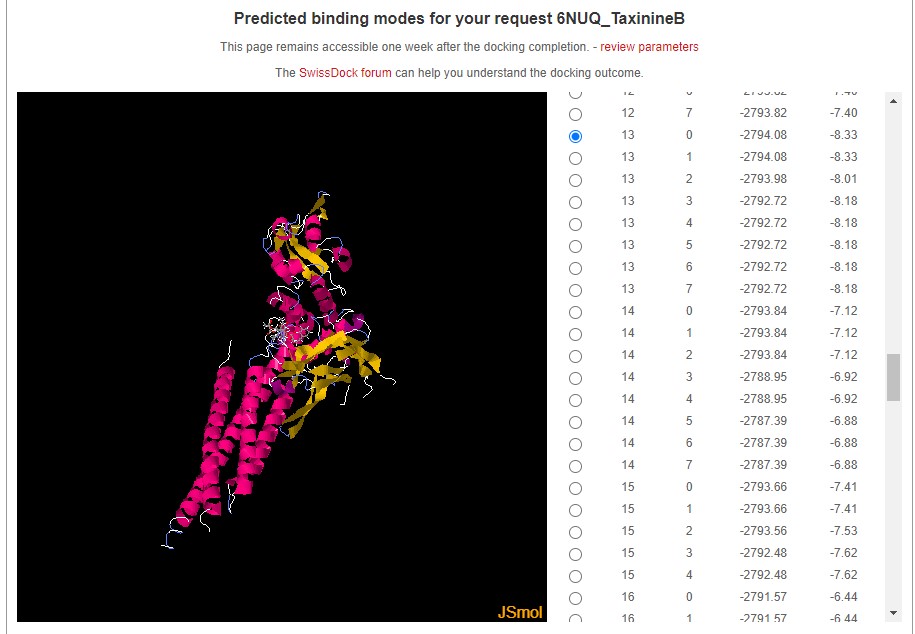
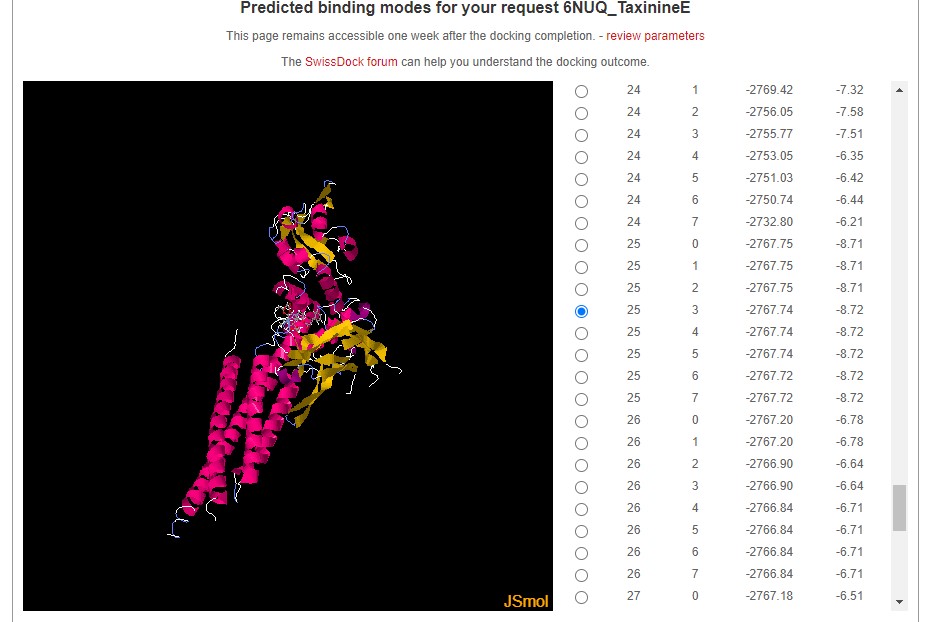
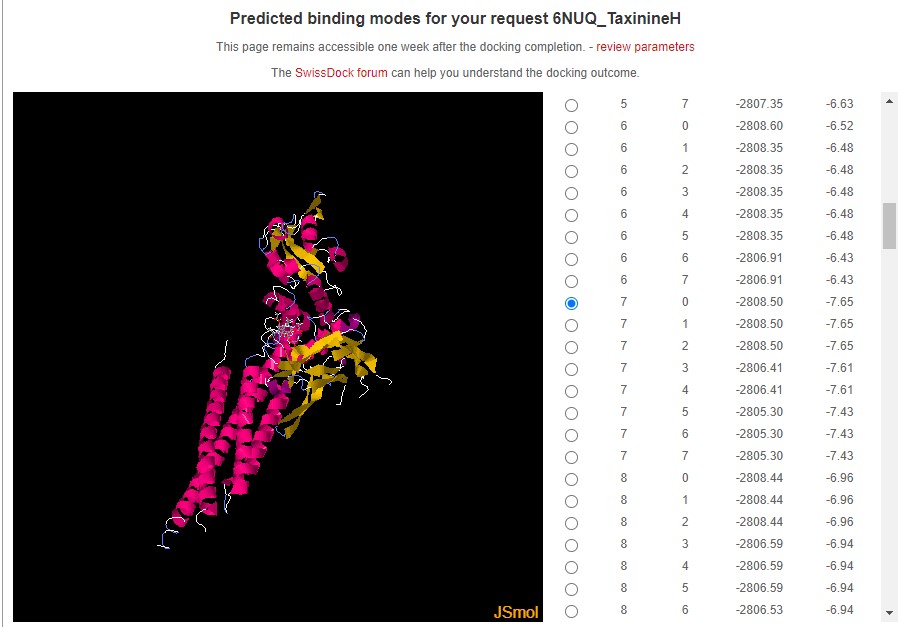
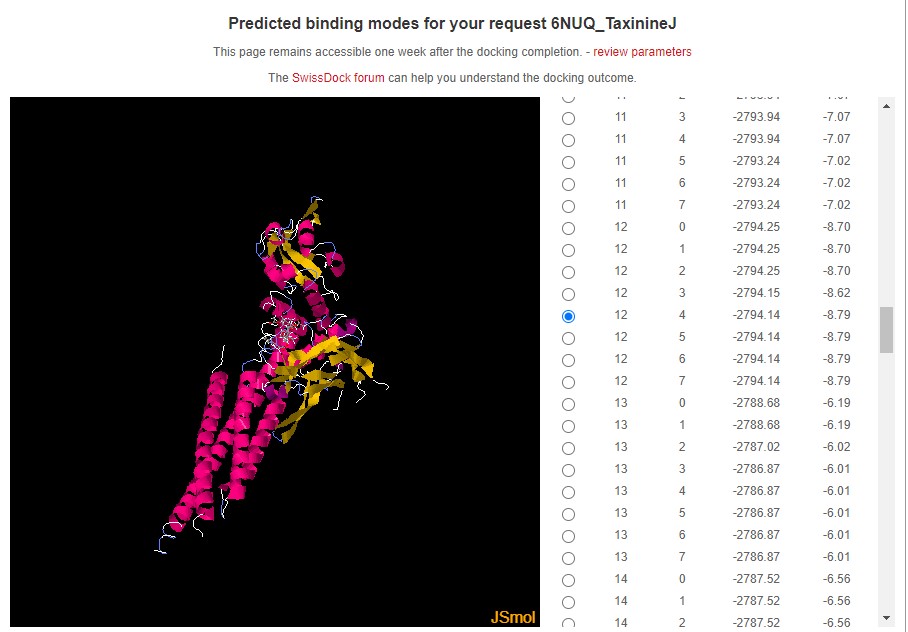
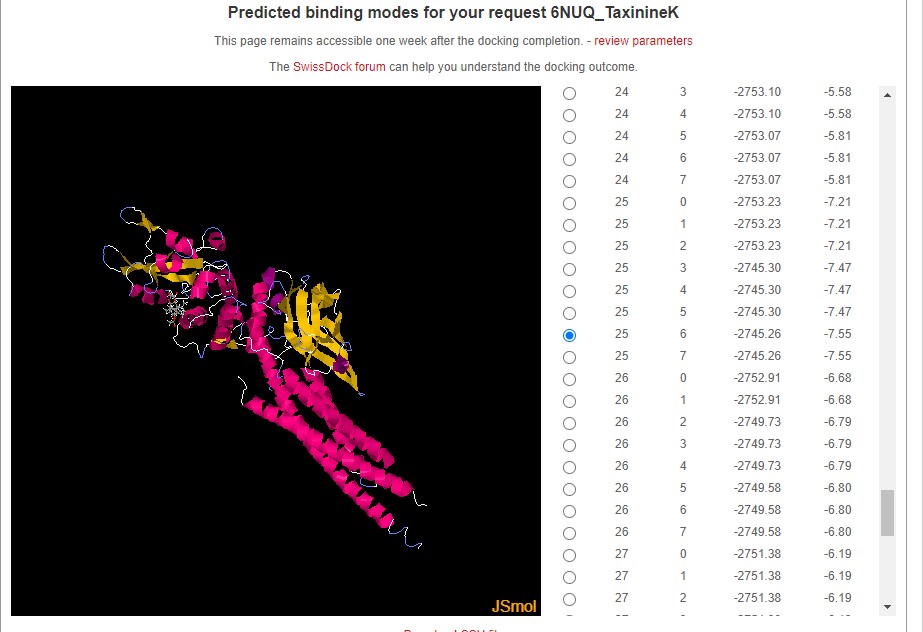
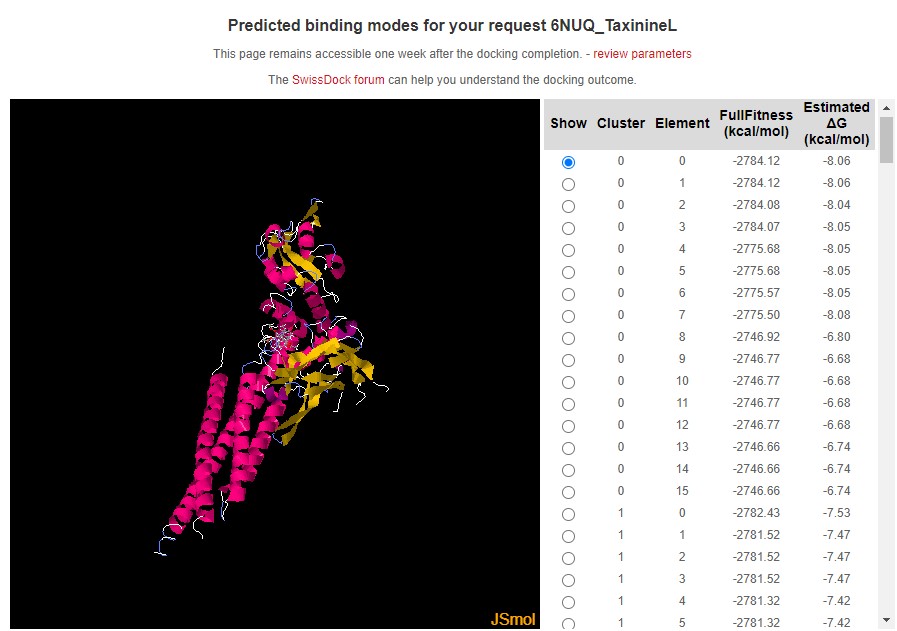
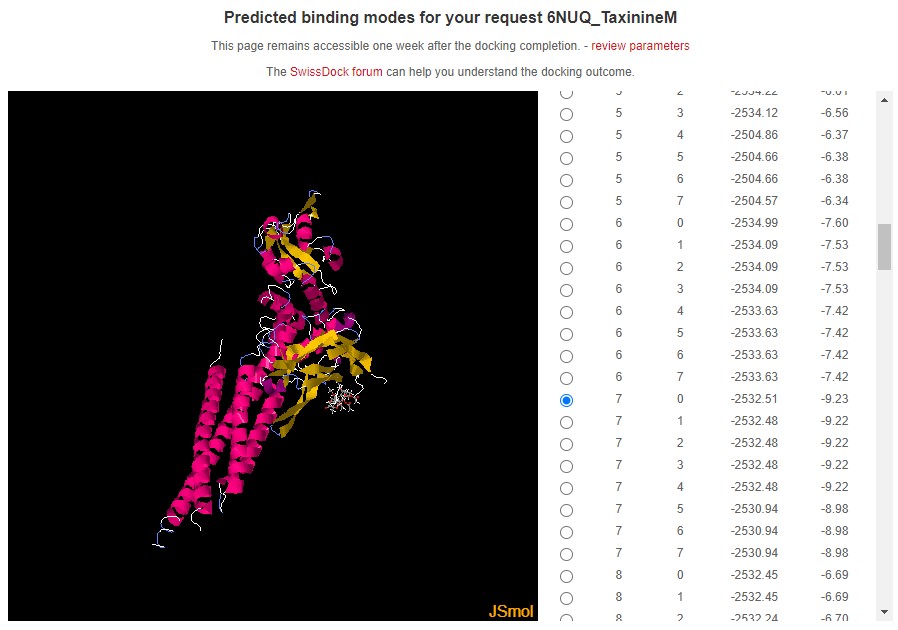
Aquí tenim les unions moleculars obtingudes amb aquest software del Swiss Institute of Bioinformatics
Amb la proteïna 6NUQ la TaxinineM és el component que té el valor més negatiu d'energia d'unió (-9.23 kcal/mol) superant al Taxol (-8.28 kcal/mol)
Aquests gràfics els he obtingut mitjançant un codi del Google colab. Una pàgina web que permet programar i executar Python, entre altres opcions dintre del navegador.
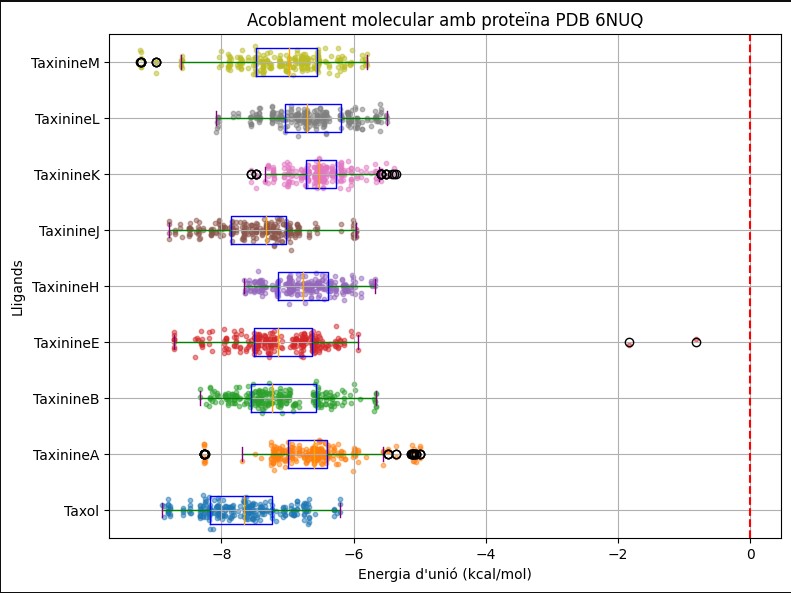
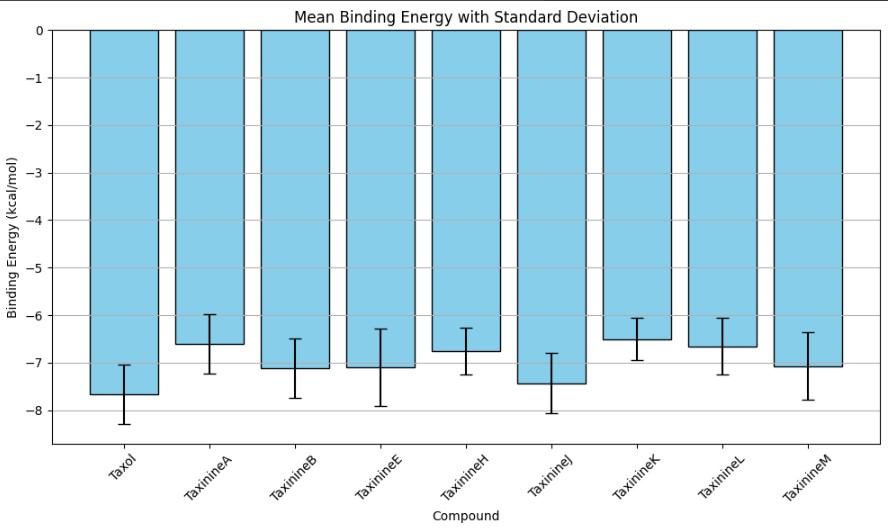
El primer gràfic és un model boxplot, en el que es mostren els components analitzats per veure la distribució de les dades. A mes a mes permet que hi hagi una comprensió ràpida del seu comportament.Tot i que en la mol·lècula hi ha una unió de -9.23 kcal/mol per a la TaxinineM, al gràfic boxplot podem observar que aquets valors es podrien identifiar com valors atipics. El Taxol és llavors, el component en el qual la majoria de dades s'agrupen dins una distribució normal, sent el component amb més valors compatibles amb la proteïna 6NUQ. Això es confirma amb el gràfic de barres on el Taxol té valors més negatius davant la TaxinineM.
Com a conclusió dels gràfics el Taxol és el component que té més possibilitats d'unió en la proteïna 6NUQ i per tant més probabilitat de que no s'uneixi a una molècula cancerígena i es propagui.
# 2. Upload deltaG_values.csv of every docking to generate a boxplot to obtain a summary table transposed data in csv and boxplot
# Has de pujar els diferents arxius i penjar cancel quan acabis, posar els noms en català (en aquest exemple: Taxinina A, etc)
# Després has d'escriure el codi PDB de la teva proteïna (en aquest exemple 4HFZ)

from google.colab import files
import pandas as pd
import matplotlib.pyplot as plt
import io
import numpy as np

# Initialize an empty list to store DataFrame objects
dfs = []

# Upload CSV files one by one
print("Upload CSV files one by one. Press Cancel to stop uploading.")
while True:
    uploaded_files = files.upload()
    if len(uploaded_files) == 0:
        break
    for filename, contents in uploaded_files.items():
        # Read CSV file as DataFrame and append it to the list
        df = pd.read_csv(io.StringIO(contents.decode('utf-8')), header=None)
        # Add a column to identify the compound
        df['Compound'] = f'Compound {chr(ord("A") + len(dfs))}'
        dfs.append(df)

# Concatenate DataFrames vertically
combined_df = pd.concat(dfs, ignore_index=True)

# Transpose the DataFrame so that rows become columns
transposed_df = combined_df.set_index('Compound').T

# Save the transposed DataFrame to a new CSV file
transposed_csv_path = 'transposed_data.csv'
transposed_df.to_csv(transposed_csv_path)

# Prompt the user to enter real chemical names for each compound
real_names_mapping = {}
for i, df_name in enumerate(transposed_df.columns):
    real_name = input(f"Enter the real chemical name for {df_name}: ")
    real_names_mapping[df_name] = real_name

# Prompt the user to enter the last word of the graph title
graph_title_suffix = input("Enter the last word of the graph title: ").strip()

# Create a customized boxplot for compounds
plt.figure(figsize=(8, 6))

# Set colors
box_color = 'blue'
median_color = 'orange'
whisker_color = 'green'
cap_color = 'purple'

# Create a boxplot
boxprops = dict(color=box_color)
medianprops = dict(color=median_color)
whiskerprops = dict(color=whisker_color)
capprops = dict(color=cap_color)
boxplot = transposed_df.boxplot(vert=False, return_type='dict', boxprops=boxprops, medianprops=medianprops, whiskerprops=whiskerprops, capprops=capprops)

# Overlay individual data points
for df_name in transposed_df.columns:
    y = np.random.normal(list(transposed_df.columns).index(df_name) + 1, 0.1, size=len(transposed_df[df_name]))
    plt.scatter(transposed_df[df_name], y, alpha=0.5, s=10)

# Set ticks and labels
plt.yticks(np.arange(1, len(transposed_df.columns) + 1), [real_names_mapping[col] for col in transposed_df.columns])

plt.xlabel("Energia d'unió (kcal/mol)")
plt.ylabel("Lligands")
plt.title(f"Acoblament molecular amb proteïna PDB {graph_title_suffix}")
plt.grid(True)
plt.axvline(x=0, color='red', linestyle='--')  # Add line at 0 for reference
plt.tight_layout()

# Save the plot as an image file
plot_image_path = 'boxplot.png'
plt.savefig(plot_image_path)

# Download the transposed CSV file and the plot image
files.download(transposed_csv_path)
files.download(plot_image_path)

# Print paths to the saved files
print("Transposed data saved to:", transposed_csv_path)
print("Plot image saved to:", plot_image_path)
# 3. Upload several deltaG_values.csv from different molecular dockings to obtain a bar type figure

from google.colab import files
import pandas as pd
import matplotlib.pyplot as plt
import io

# Initialize an empty list to store DataFrame objects
dfs = []

# Upload CSV files one by one
print("Upload CSV files one by one. Press Cancel to stop uploading.")
while True:
    uploaded_files = files.upload()
    if len(uploaded_files) == 0:
        break
    for filename, contents in uploaded_files.items():
        # Read CSV file as DataFrame and append it to the list
        df = pd.read_csv(io.StringIO(contents.decode('utf-8')), header=None)
        # Add a column to identify the compound
        df['Compound'] = f'Compound {chr(ord("A") + len(dfs))}'
        dfs.append(df)

# Concatenate DataFrames vertically
combined_df = pd.concat(dfs, ignore_index=True)

# Transpose the DataFrame so that rows become columns
transposed_df = combined_df.set_index('Compound').T

# Save the transposed DataFrame to a new CSV file
transposed_csv_path = 'transposed_data.csv'
transposed_df.to_csv(transposed_csv_path)

# Prompt the user to enter customized names for each compound
custom_names_mapping = {}
for i, df_name in enumerate(transposed_df.columns):
    custom_name = input(f"Enter customized name for {df_name}: ")
    custom_names_mapping[df_name] = custom_name

# Calculate statistics for each compound
statistics_df = pd.DataFrame({
    'Mean': transposed_df.mean(),
    'Standard Deviation': transposed_df.std(),
    'Minimum': transposed_df.min(),
    'Maximum': transposed_df.max(),
    'Number of Data': transposed_df.count()
})

# Save statistics to a CSV file
statistics_csv_path = 'compound_statistics.csv'
statistics_df.to_csv(statistics_csv_path)

# Create a bar graph with mean and standard deviation
plt.figure(figsize=(10, 6))
mean_values = statistics_df['Mean']
std_values = statistics_df['Standard Deviation']
plt.bar([custom_names_mapping[col] for col in mean_values.index], mean_values, yerr=std_values, capsize=5, color='skyblue', edgecolor='black')
plt.xlabel('Compound')
plt.ylabel('Binding Energy (kcal/mol)')
plt.title('Mean Binding Energy with Standard Deviation')
plt.xticks(rotation=45)
plt.grid(axis='y')
plt.tight_layout()

# Save the plot as an image file
plot_image_path = 'mean_with_std_bar_plot.png'
plt.savefig(plot_image_path)

# Download the transposed DataFrame, statistics CSV file, and plot image
files.download(transposed_csv_path)
files.download(statistics_csv_path)
files.download(plot_image_path)

# Display the statistics DataFrame
statistics_df