This project compares graphs of nine air pollutants in Igualada, Catalonia, from 1991 to 2022. The data show trends for each pollutant over time, making it possible to identify significant changes and particular events that affected air quality at that time.
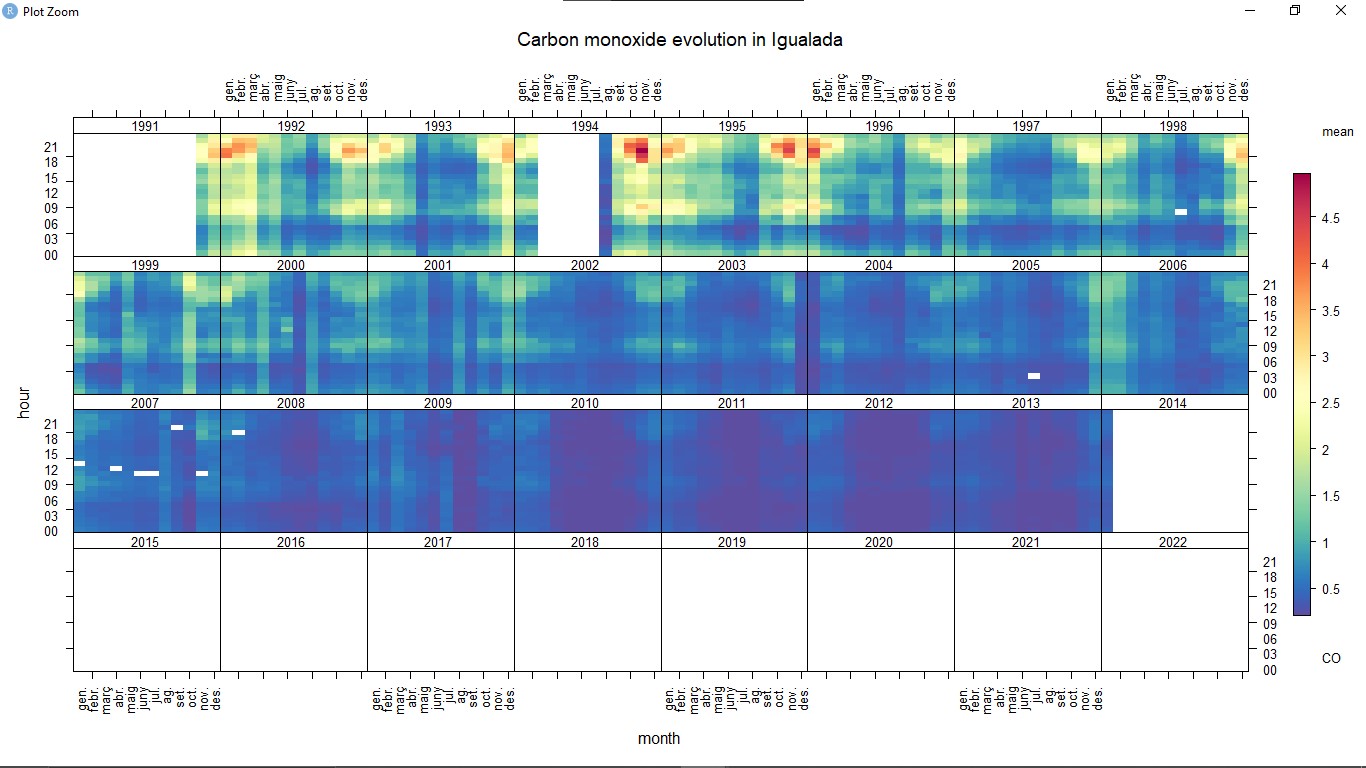
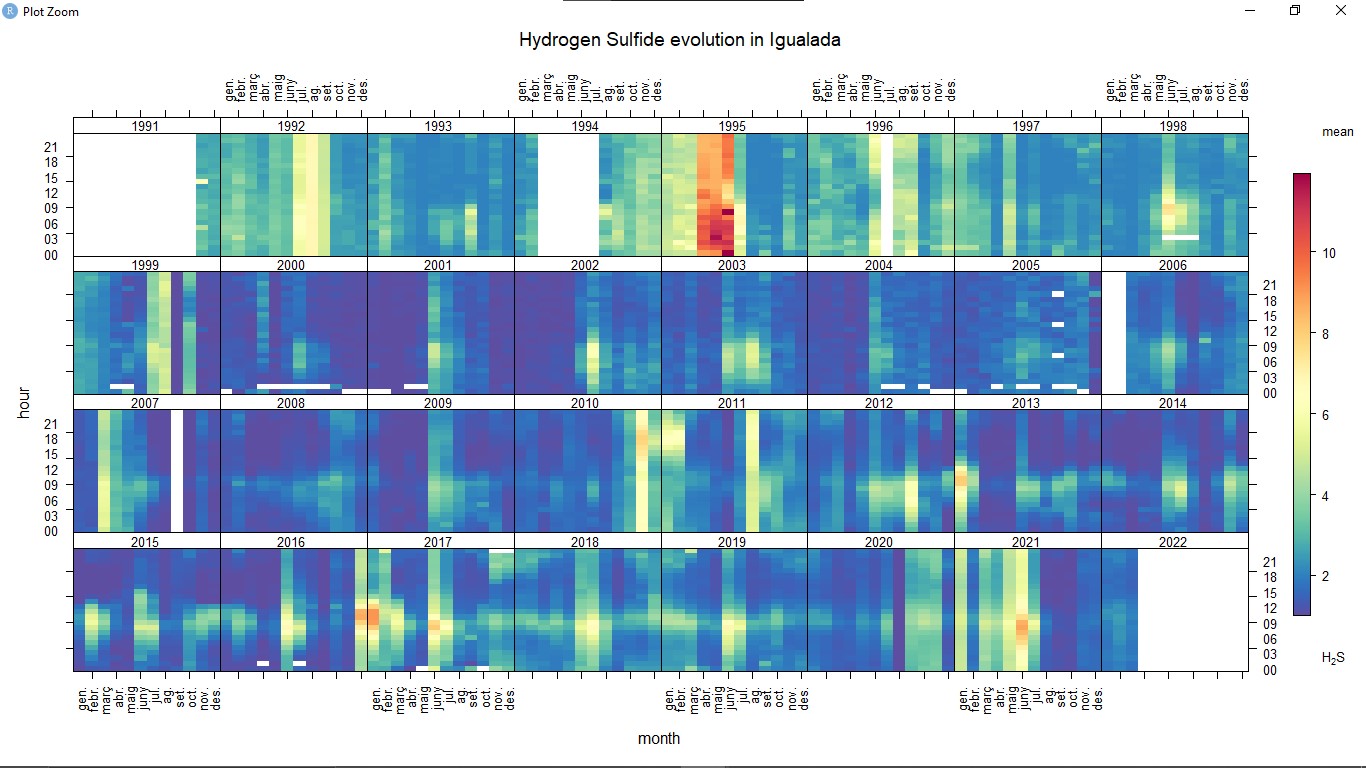
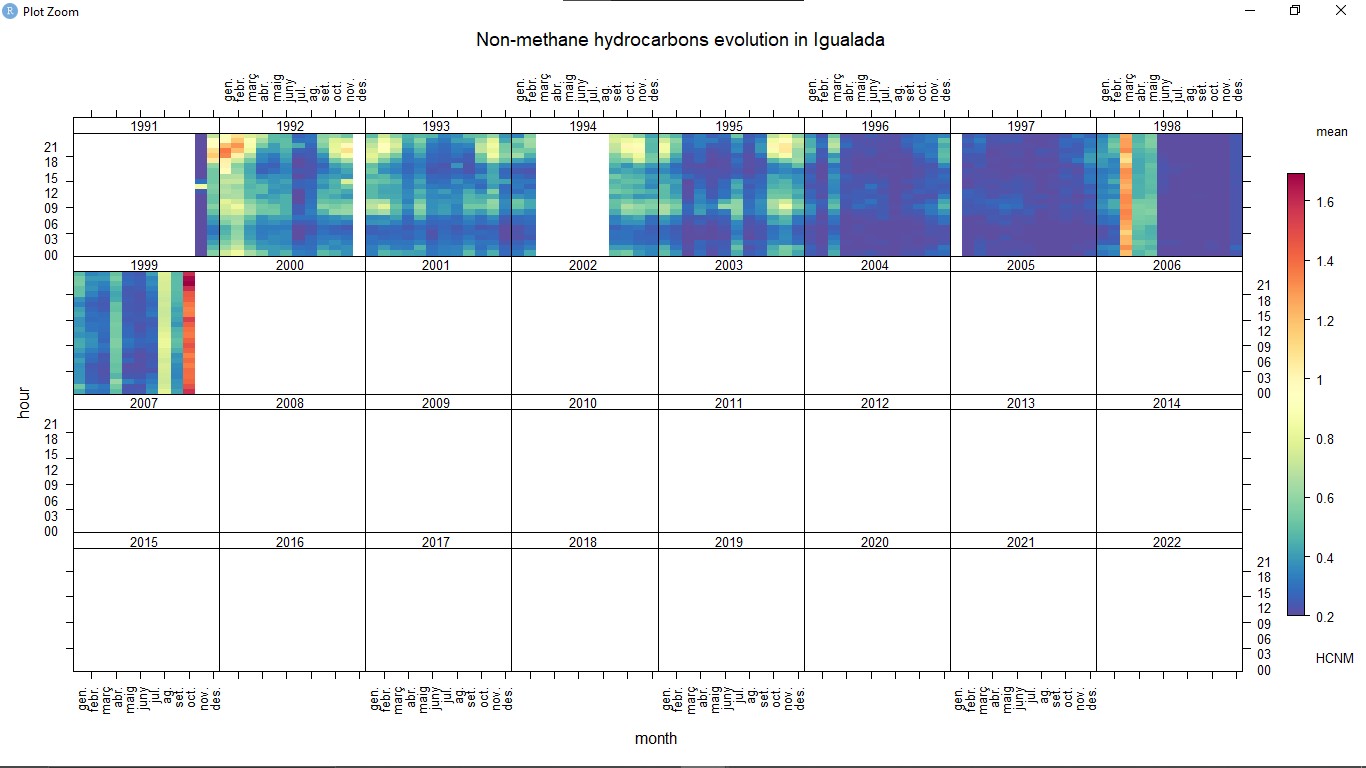

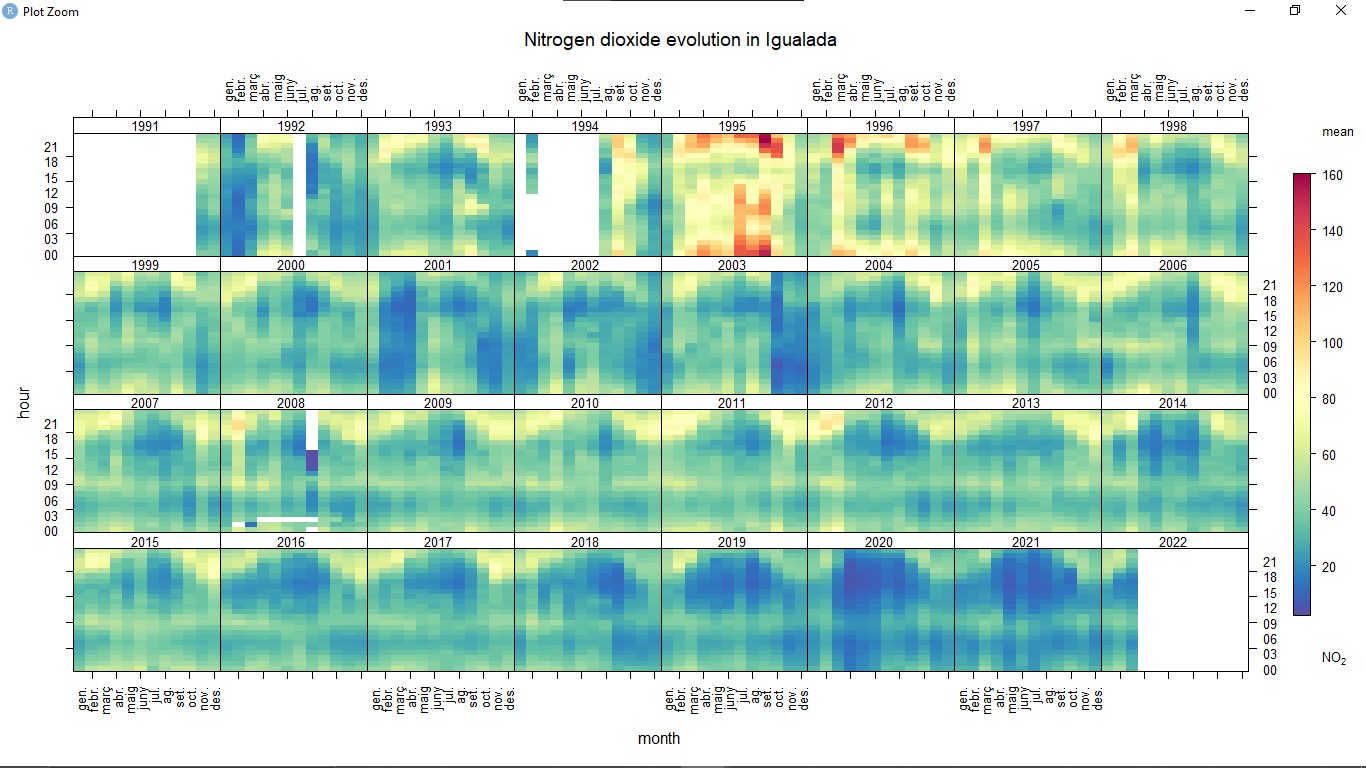
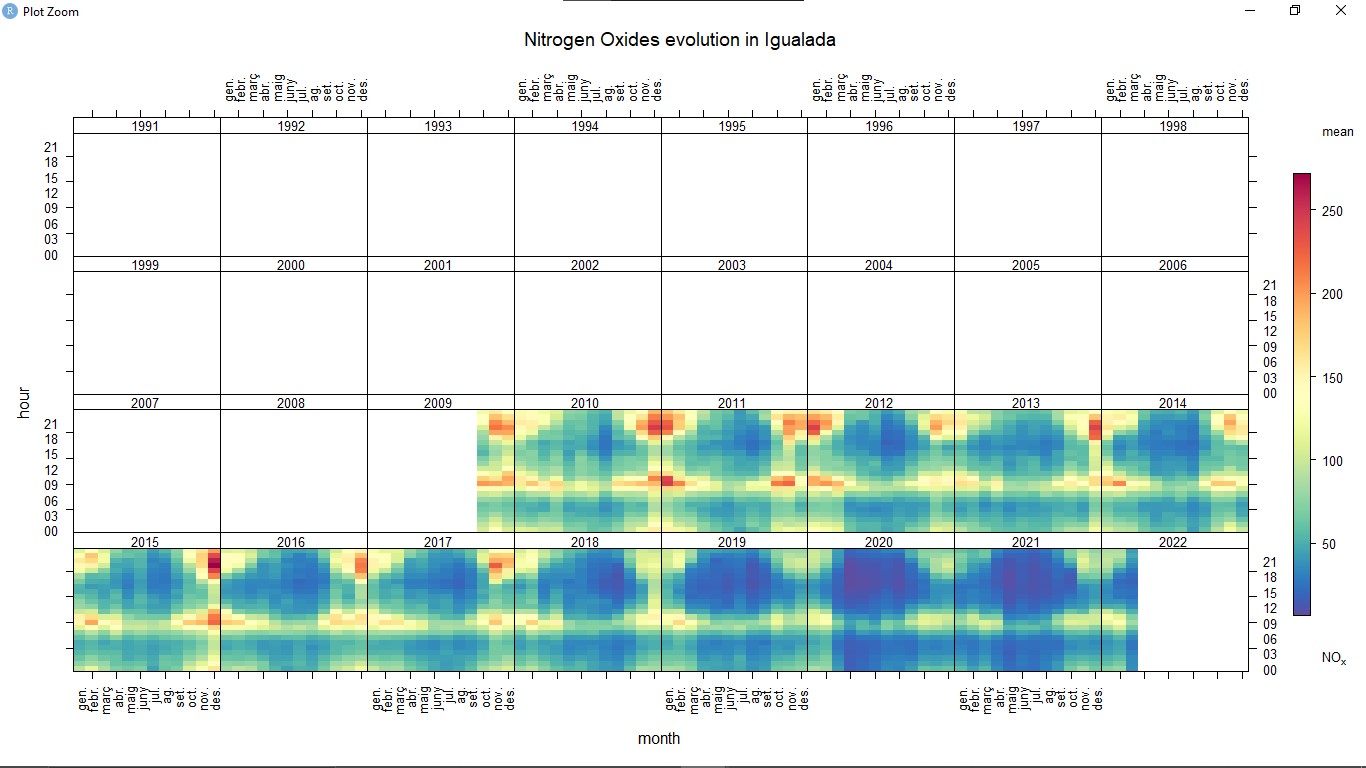
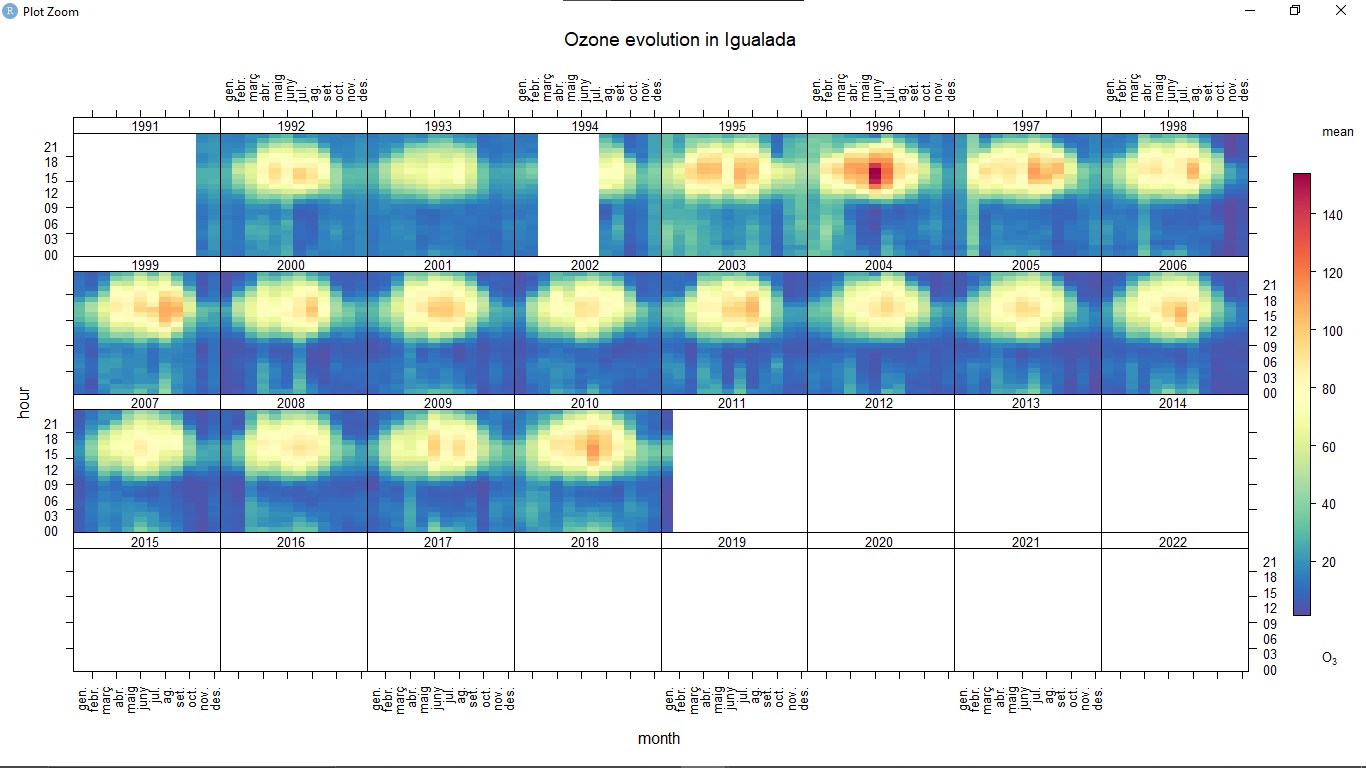
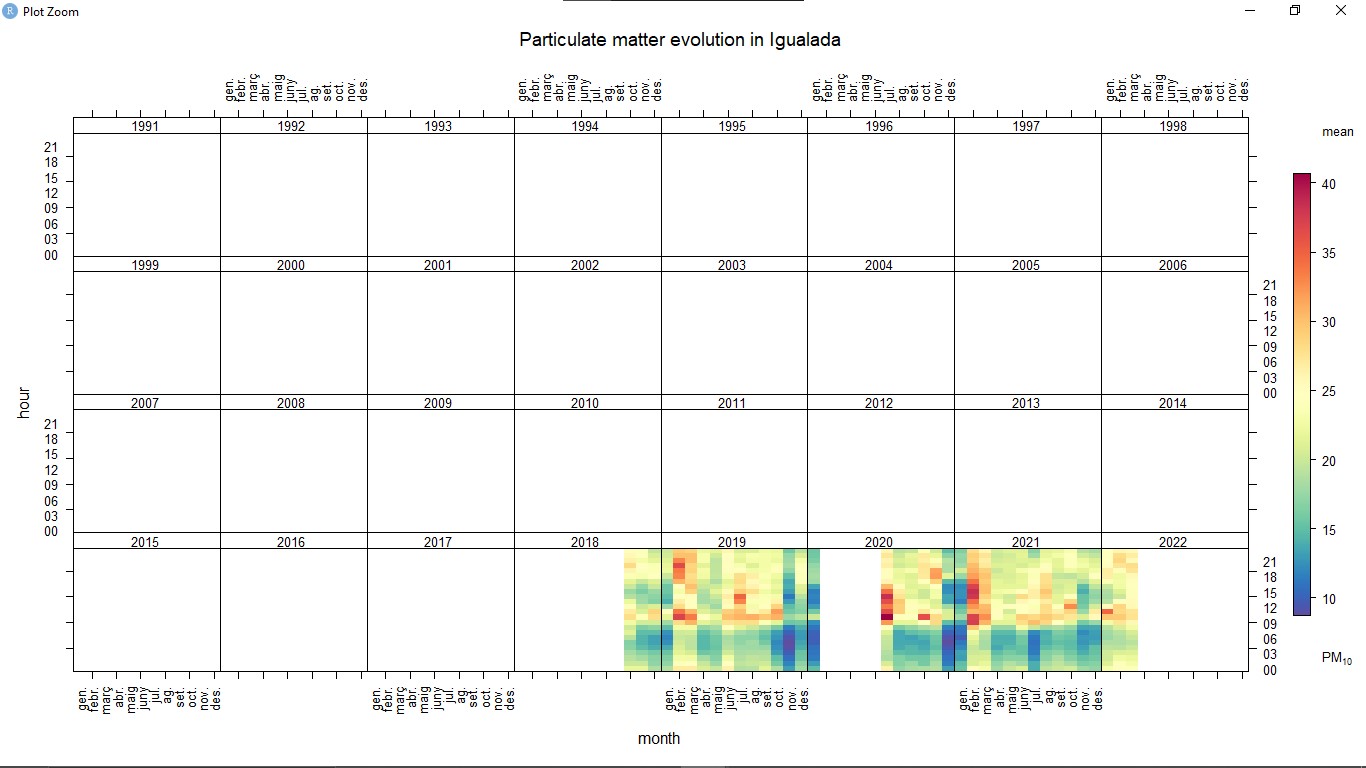
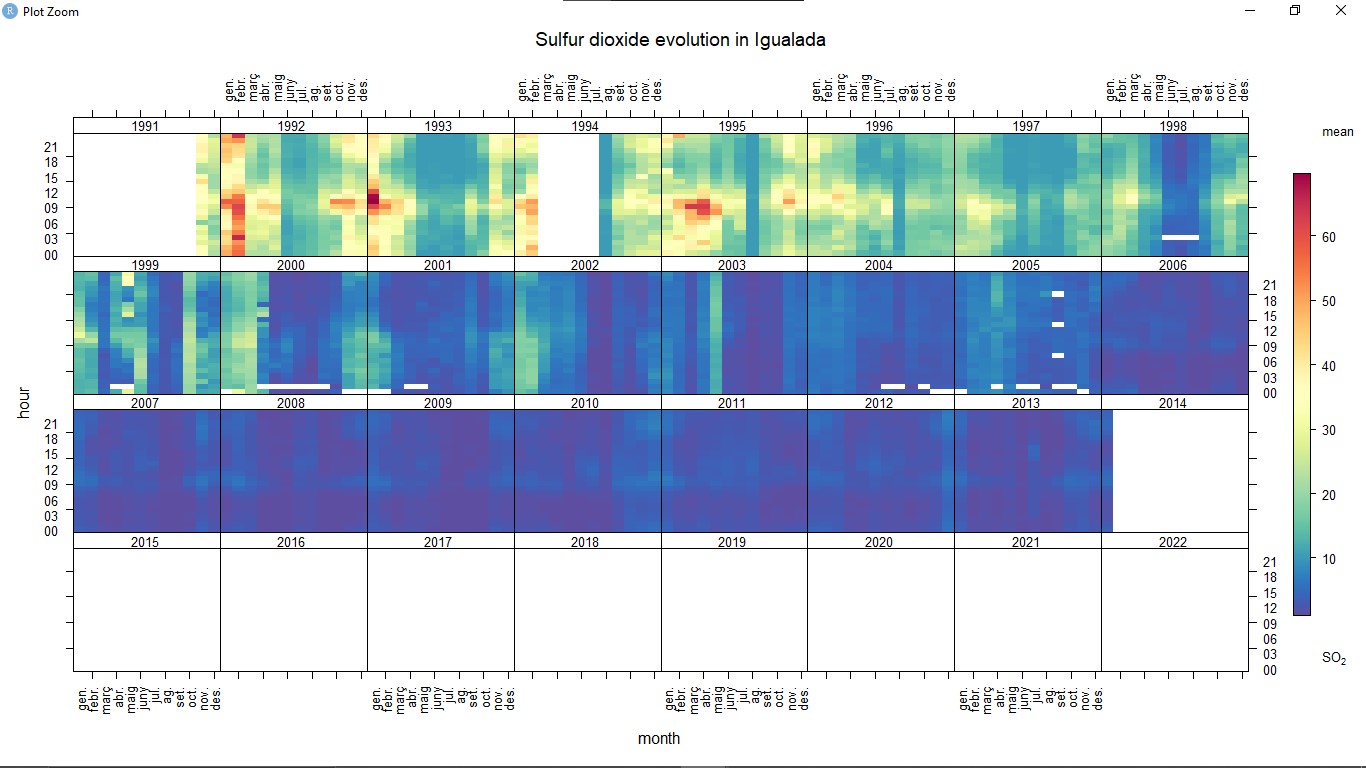
The graphs show the evolution of the concentration of various pollutants in the city of Igualada over several decades. When analyzing these data, significant trends and patterns can be observed that reflect important changes in air quality in this region. First, a decrease in carbon monoxide (CO) and nitrogen oxides (NO) is observed after 2000. During the 1990s, levels of these pollutants were considerably higher. This post-2000 reduction can be attributed to various environmental policies and improvements in emission reduction technologies. For example, the implementation of stricter vehicle emissions regulations and the promotion of cleaner energy sources may have contributed to this reduction. As for hydrogen sulfide (H2S), the data show a peak in 1995. This increase could be related to industrial activities that emitted large quantities of H2S at that time or to exceptional meteorological conditions that helped the accumulation of this pollutant in the atmosphere. On the other hand, non-methane hydrocarbons (NMHC) show significant peaks in the years 1998 and 1999. These peaks are observed in the months of October and March. The considerable increase in these months may be due to certain seasonal activities, such as increased use of heating or events, among others.
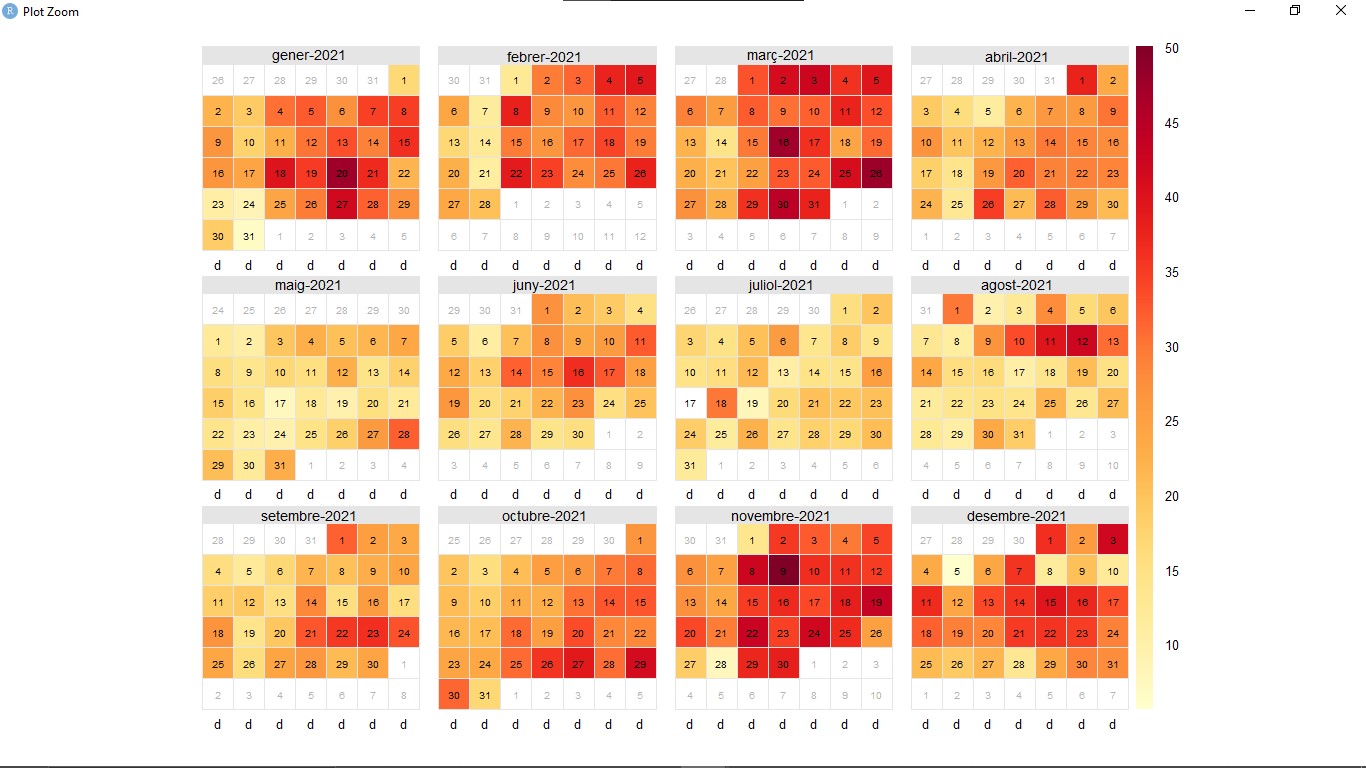
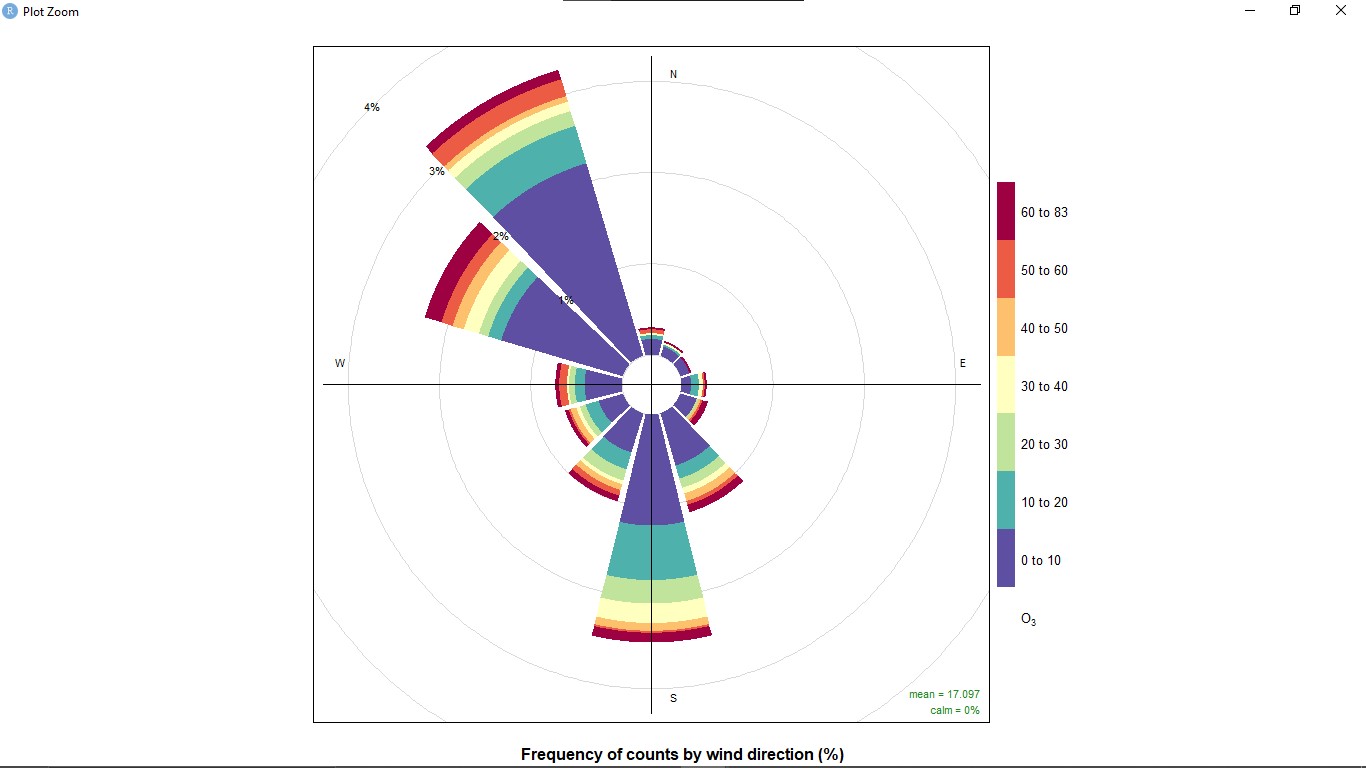
The last two graphs show the days with the highest pollution and the frequency of counts by wind direction in Igualada. The graph of high pollution days identifies specific periods with elevated pollution levels. These peaks may be related to seasonal factors, such as the use of heating in winter, or to industrial and meteorological events that hinder the dispersion of pollutants. The wind direction graph shows which direction the wind is coming from. By identifying predominant wind directions and high pollution days coinciding with winds from a specific direction, this can indicate that measures can be taken to control specific emission sources.